Application Monitoring Made Easy: A Guide to Prometheus and Grafana

Introduction
In this blog post, I'm going to explain application monitoring with Prometheus and Grafana. We will focus on the basics, and it will be easy to follow along. In the end, we will have a simple HTTP web application running locally, a docker-based deployment of Prometheus and Grafana to monitor our application and some load-testing scripts with K6 to generate load and see our metrics in real-time.
Prerequisites
You will need Docker installed on your machine, just follow the installation instructions on the official website if you don't have it. For Windows users, I just suggest to user WSL2 (Windows Subsystem for Linux) as it will be much easier to follow the tutorial. To verify that docker is running let's run a command in the terminal:
docker --version
> Docker version 24.0.2, build cb74dfc
Also, we will be using Docker Compose to start Prometheus, Grafana and our application in the containers that can talk to each other, so let's verify that it is installed:
docker-compose --version
> Docker Compose version v2.19.1
Also, I suggest you use the asdf-vm tool as a version manager as we will need to install a couple of dependencies like Java, and Quarkus CLI (alternatively you can install them manually).
As I'm on the Mac, I prefer to use brew to install asdf, as simple as:
brew install asdf
asdf --version
> v0.12.0
Building the application
So let's create our Java application that we will monitor with Prometheus. I'm going to use Quarkus to bootstrap it. First of all, let's install the Quarkus CLI that we will use to generate the application. There is a plugin for it in asdf, so it looks like:
asdf plugin add quarkus
asdf install quarkus latest
asdf global quarkus latest
quarkus --version
> 3.2.2.Final
Once we have it installed, let's generate and start a new application:
quarkus create prometheus-monitoring-basics
cd prometheus-monitoring-basics
quarkus dev
Now we can validate that it is actually running by executing (or just navigate to http://localhost:8080 in your browser):
curl http://localhost:8080/hello
> Hello from RESTEasy Reactive
Let's create a new REST endpoint that we will be using for testing: /fibonacci. It will generate a random integer N in a range from 0 to 50 and calculate a Fibonacci number for it, so the request response will be different for each call. To do it - copy the GreetingResource.java to RandomFibonacciResource.java and change the code to the following:
package org.acme;

import jakarta.ws.rs.GET;
import jakarta.ws.rs.Path;
import jakarta.ws.rs.Produces;
import jakarta.ws.rs.core.MediaType;

import java.util.Random;

@Path("/fibonacci")
public class RandomFibonacciResource {

    public static long fibonacci(long n) {
        if (n == 1 || n == 2) {
            return 1;
        }
        return fibonacci(n - 1) + fibonacci(n - 2);
    }

    @GET
    @Produces(MediaType.TEXT_PLAIN)
    public String fibonacci() {
        Random random = new Random();
        int n = random.ints(0, 50)
            .findFirst()
            .getAsInt();
        return String.format("fib(%s) = %s", n, fibonacci(n));
    }
}
We can test that it's working by calling the endpoint:
curl http://localhost:8080/fibonacci
> fib(13) = 233
OK, cool! It's time to dive into the monitoring setup. First of all, Quarkus framework gives you an easy option to enable metrics with a Micrometer plugin. So let's add it to our app with the CLI command:
quarkus extension add 'micrometer-registry-prometheus'
And we should now have a new endpoint available in our app: /q/metrics. This endpoint will be used by Prometheus Server to periodically pull metrics from the application.
Navigate to http://localhost:8080/q/metrics or execute:
curl http://localhost:8080/q/metrics
Your should see something like this:
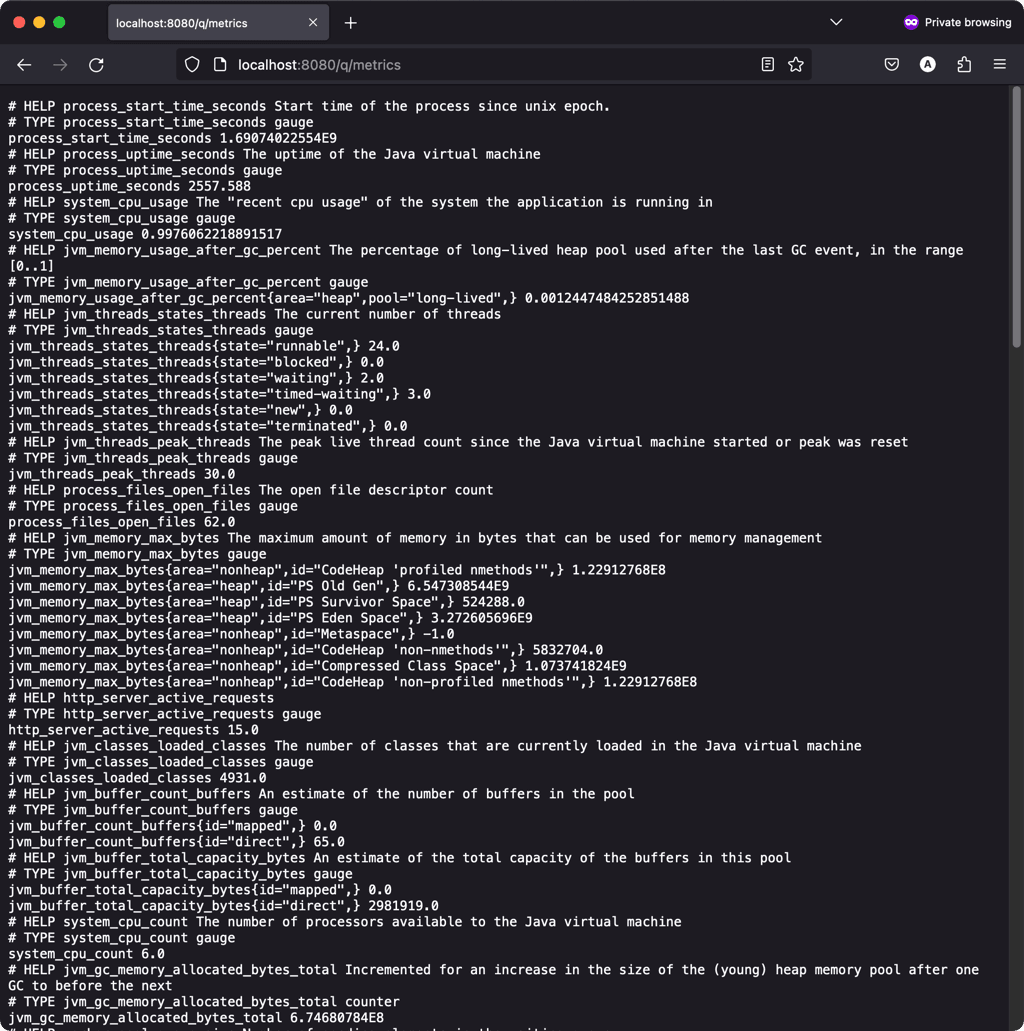
As we can see - we have a bunch of metrics available out of the box, e.g. JVM metrics and our HTTP server metrics. Let's focus on these lines:
# TYPE http_server_requests_seconds summary
# HELP http_server_requests_seconds
http_server_requests_seconds_count{method="GET",outcome="SUCCESS",status="200",uri="/fibonacci"} 1.0
http_server_requests_seconds_sum{method="GET",outcome="SUCCESS",status="200",uri="/fibonacci"} 0.009856167
It means that we have a collector of the summary type inside our application that tracks HTTP calls: count of the calls and duration of the call and the dimensions are method, outcome, status and uri.
There are 4 metric types in Prometheus: counter, summary, gauge and histogram. If you are not familiar with those, I just recommend reading the official doc explaining it: https://prometheus.io/docs/concepts/metric_types.
Running Prometheus, Grafana and the application
The next step is to start Prometheus, Grafana and our Java application locally and connect them. The easiest option is to use a docker-compose.yml file, let's take a look:
version: '3.8'

networks:
  prometheus-monitoring-basics:
    driver: bridge

volumes:
  prometheus_data: {}
  grafana_data: {}

services:
  grafana:
    image: grafana/grafana-oss
    container_name: grafana
    restart: unless-stopped
    ports:
      - '3000:3000'
    volumes:
      - 'grafana_data:/var/lib/grafana'
    networks:
      - prometheus-monitoring-basics
  prometheus:
    image: prom/prometheus:latest
    container_name: prometheus
    restart: unless-stopped
    volumes:
      - ./prometheus.yml:/etc/prometheus/prometheus.yml
      - prometheus_data:/prometheus
    command:
      - '--config.file=/etc/prometheus/prometheus.yml'
      - '--storage.tsdb.path=/prometheus'
      - '--web.console.libraries=/etc/prometheus/console_libraries'
      - '--web.console.templates=/etc/prometheus/consoles'
      - '--web.enable-lifecycle'
    expose:
      - 9090
    ports:
      - '9090:9090'
    networks:
      - prometheus-monitoring-basics
  app:
    container_name: prometheus-monitoring-basics-app
    build:
      context: .
      dockerfile: ./src/main/docker/Dockerfile.jvm
    ports:
      - '8080:8080'
    networks:
      - prometheus-monitoring-basics
  k6:
    image: grafana/k6:latest
    command: run /load.js
    volumes:
      - ./load.js:/load.js
    networks:
      - prometheus-monitoring-basics
Also, we need to pass prometheus.yml file with the Prometheus configuration.
global:
  scrape_interval: 10s

scrape_configs:
  - job_name: 'prometheus'
    static_configs:
      - targets: ['prometheus:9090']

  - job_name: 'app'
    metrics_path: '/q/metrics'
    static_configs:
      - targets: ['prometheus-monitoring-basics-app:8080']
It's pretty basic in our case. As we only have a single application to monitor we can use static configuration for targets. In the real-world examples, there are other options supported by Prometheus, e.g. kubernetes_sd or consul_sd.
But let's step back to understand what is a target and how Prometheus is working.
Prometheus consists of 3 parts:
- Storage: time-series database to store the metrics
- Retriever: to discover applications to monitor and pull metrics
- HTTP server: to serve requests about metrics (PromQL)
In our config, we have a single static scrape target and scrap interval of 10 seconds, so Prometheus will call GET https://our-app:8080/q/metrics every 10 seconds, it will read the response, and it knows how to store that response in the internal time-series database. Once we have data flowing the internal storage we can use UI or external tools like Grafana to query and visualize metrics.
You potentially noticed that in the docker-compose.yml we also have an additional service called k6. It's a nice tool for load-testing, and it will generate some requests to our application, so we can see our metrics in real-time. You can read more about it as it's pretty cool and versatile: https://k6.io/docs/get-started/ . For our needs the script is trivial - add load.js to the root of the project:
import http from 'k6/http';

export const options = {
    stages: [
        { duration: '1h', target: 20 }
    ]
};

export default function () {
    http.get('http://prometheus-monitoring-basics-app:8080/fibonacci');
}
Now it's finally time to start our stack. Note that we need to build a Java application first:
quarkus build
docker-compose up -d --build
docker-compose ps
Now we have a bunch of apps running: our Java application is on http://localhost:8080, Prometheus is on http://localhost:9090 and Grafana is on http://localhost:3000.
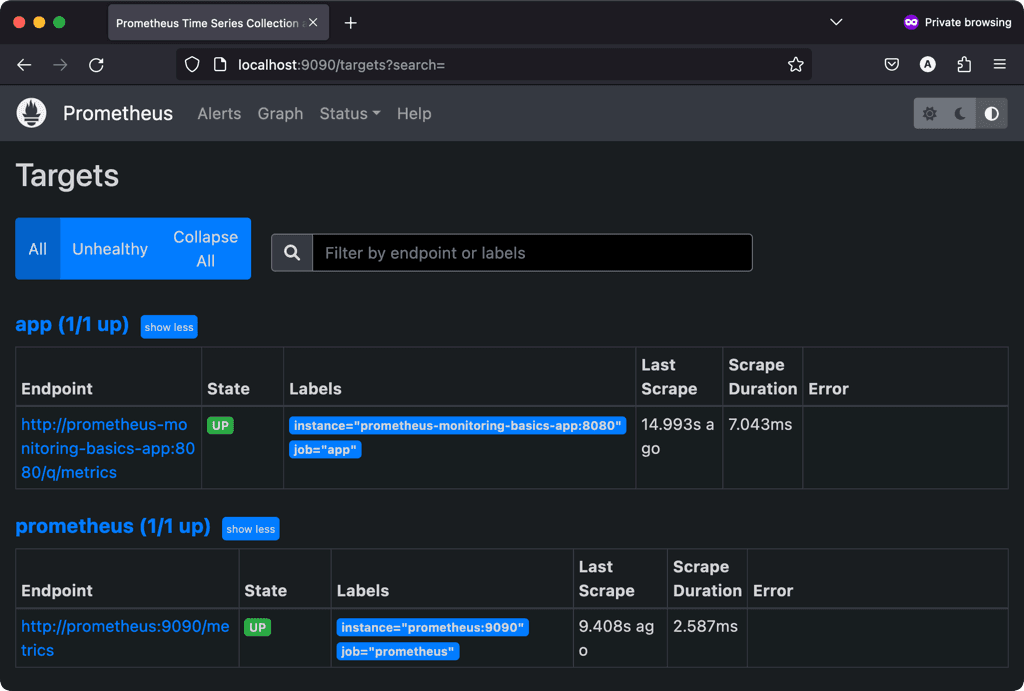
Let's navigate to http://localhost:9090/targets. Here we should see the list of our targets, should be no surprise as we hard-coded them in the YAML configuration, in the production setup this list will be dynamic based on your service discovery.
Let's now explore the graph tab: navigate to http://localhost:9090/graph, type http_server_requests_seconds_count in the expression input and click execute.
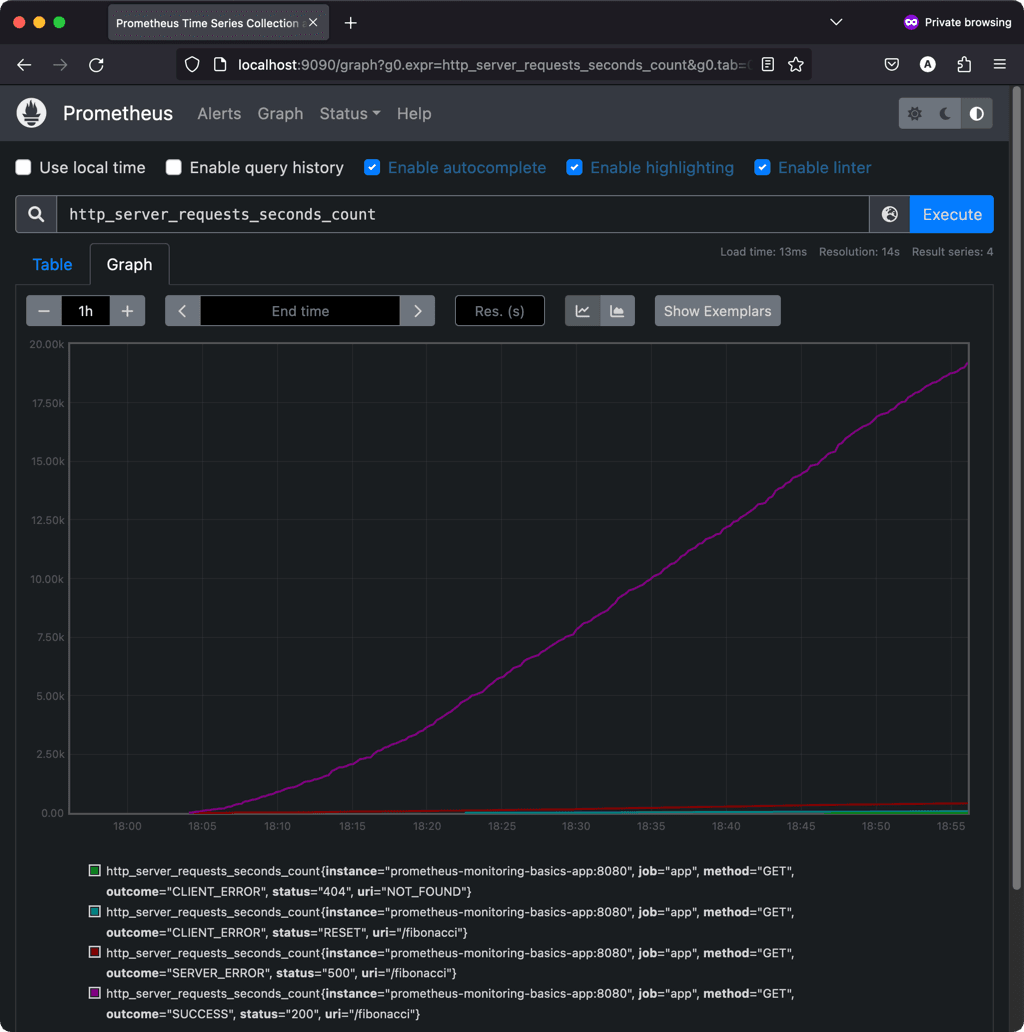
While the Prometheus UI could be useful to explore available metrics and build some ad-hoc graphs, overall it's rather basic, so usually people prefer other tools to visualize metrics. A popular example is Grafana.
Let's navigate to http://localhost:3000 and log in with the admin/admin combination (you can skip the step to create the password). Now we are inside Grafana UI and it looks much better than Prometheus UI. The final bit is to configure a data source in Grafana to use our Prometheus as a back-end for metrics. To do so go to http://localhost:3000/datasources/new and select Prometheus type. The only thing to fill in is the URL of Prometheus: http://prometheus:9090 and click Save & Test button. Now if you navigate to http://localhost:3000/explore and select your Prometheus data source - all metrics that you've seen in Prometheus are available in Grafana as well.
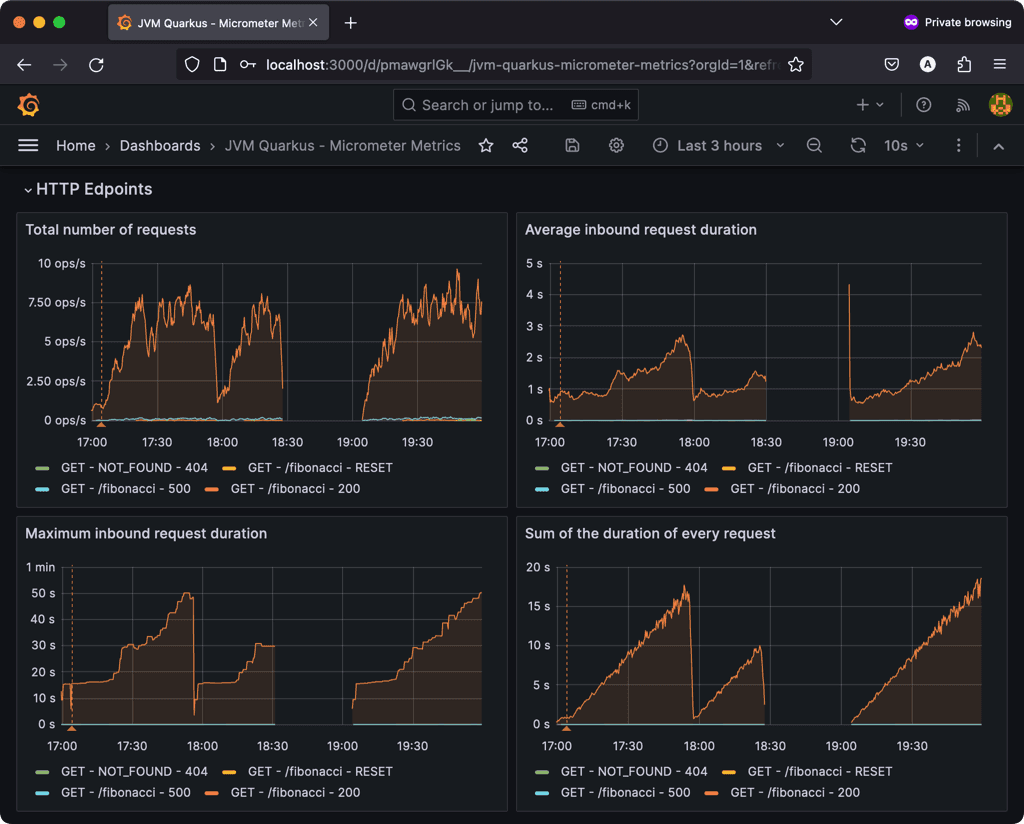
The last bit is to create a useful dashboard for our application. Luckily there is an existing one for Quarkus applications: https://grafana.com/grafana/dashboards/14370-jvm-quarkus-micrometer-metrics. You can add it to your Grafana by importing the dashboard by ID or by copying the full JSON. Let's take a look at how many requests we have generated by the K6 tool.
Recap
That's it for the introduction to the Prometheus and Grafana monitoring. Let's summarize what we've learned:
- In our application, we have to create a Prometheus registry with collectors (some popular frameworks will expose a lot of metrics out of the box).
- The Prometheus server should be configured with scrape targets (could be static or dynamic).
- The Prometheus server periodically pulls metrics from all targets (by doing HTTP requests to the metrics endpoint).
- Prometheus transforms and stores the result of each call in the internal time-series database.
- Metrics are available to visualize in the Prometheus UI.
- Alternatively, you can have a Grafana deployment with a Prometheus data source to visualize your metrics.
All the source code for this example is available on GitHub: https://github.com/andfadeev/blog-examples/tree/main/prometheus-monitoring-basics.